What Is an Insurance CRM and Which One to Choose in 2026?
An insurance CRM tracks clients, pipeline and renewals. It does not rate an endorsement or bill an installment. Six CRMs compared, and where the policy record lives.
US cyber premium fell 7% in 2024, the first decline in the market's history, while policy count held flat and loss ratios stayed strong. A price correction, not a retreat.

Cyber insurance is a specialty line designed to absorb the financial and operational shock of modern cyber threats – from ransomware and business-email compromise to privacy violations and destructive malware.
Unlike standard property or liability policies, it is engineered around intangible assets and always-on systems, where cyber risks propagate through networks, suppliers, and cloud platforms.
At its core, cyber insurance converts unpredictable digital events into a managed, contractually defined response, helping organizations keep customers, regulators, and partners confident when incidents occur.
Policies typically blend first-party and third-party cyber insurance coverage.
First-party elements fund immediate response – digital forensics, data restoration, crisis communications, breach notification, customer protection services, and business interruption losses. Third-party elements address liability arising from data breaches, regulatory investigations, contractual indemnities, and media or privacy claims.
The cyber insurance market is now a core (but still relatively small) specialty line.
The cyber insurance market grew at an ~32% compound annual rate from 2017 to 2022, roughly tripling in size over five years.
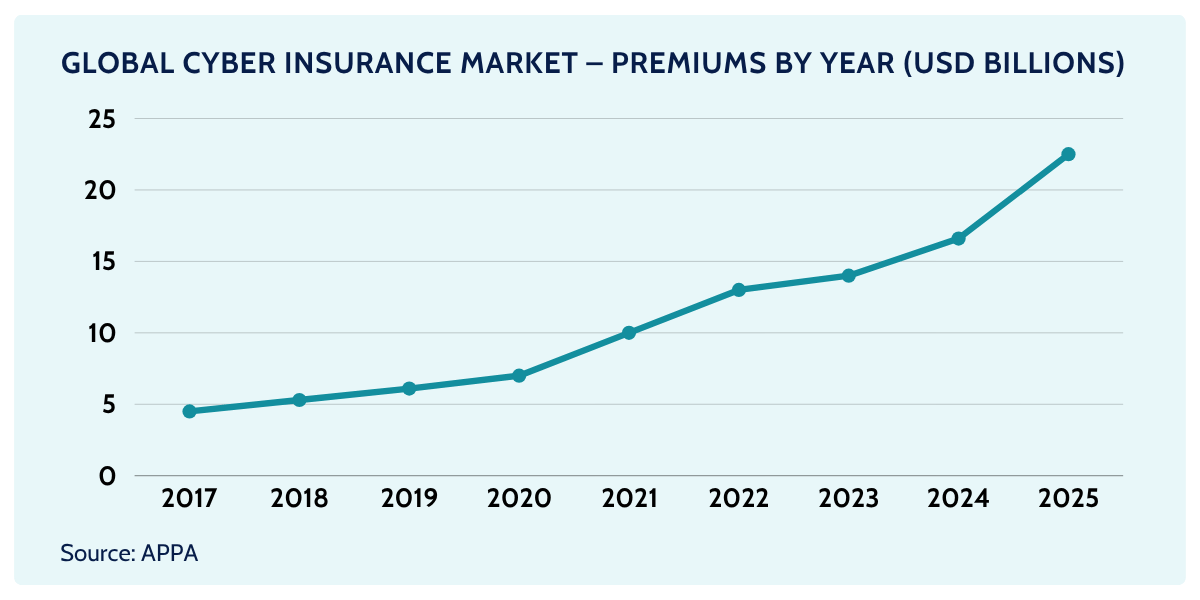
Global premiums doubled from 2017 to 2020, and then doubled again from 2020 to 2022.
By 2022, worldwide cyber insurance premiums reached about $13 billion, up from roughly $4–5 billion in 2017.
This trajectory far outpaced growth in most other insurance lines.
Depending on the source and methodology, global cyber insurance premiums for 2024 are estimated at ~USD 15–17 billion: Munich Re puts 2024 at USD 15.3bn, while Guy Carpenter estimates USD 16.6bn.
Then the direction changed. Guy Carpenter puts global gross written premium at roughly USD 16bn for 2025, essentially flat, and the US figures show an outright decline: NAIC data has US direct written premium falling 7.11% to USD 9.14bn in 2024, the first annual drop in the market's history. AM Best, measuring only standalone US cyber, found the same turn independently: USD 7.075bn in 2024, down 2.3%, its first year-over-year fall since it began tracking the line in 2015.
Growth stopped in 2024 and has not restarted
Global cyber gross written premium
Munich Re figures for 2020-2023; the 2025 estimate is Guy Carpenter’s. Definitions differ between the two, so the shape matters more than the joins.
A caveat on comparability. For 2024 filings the NAIC's Cyber Supplement moved from a two-way standalone/packaged split to a three-way primary/excess/endorsement split, and 352 of 708 insurers reported no premium at all for cyber inside package policies because they could not separate it out. The packaged side of this market is materially undercounted.
A handful of incident types dominate cyber claims across the cyber insurance market.
While loss experience ultimately varies by sector and geography, the patterns below explain why cyber insurers insist on baseline controls (MFA, EDR, backups) and why these controls increasingly influence cyber insurance premiums.
Global cyber insurance premiums have expanded rapidly from a niche base.
In 2020, the cyber insurance market was about US$6bn GWP, and heavily concentrated geographically: Americas 71%, Europe/Africa 29%, Asia/Oceania <1%. That concentration reflected where cover was most available and where cyber insurers had the strongest distribution and data to price emerging cyber risks.
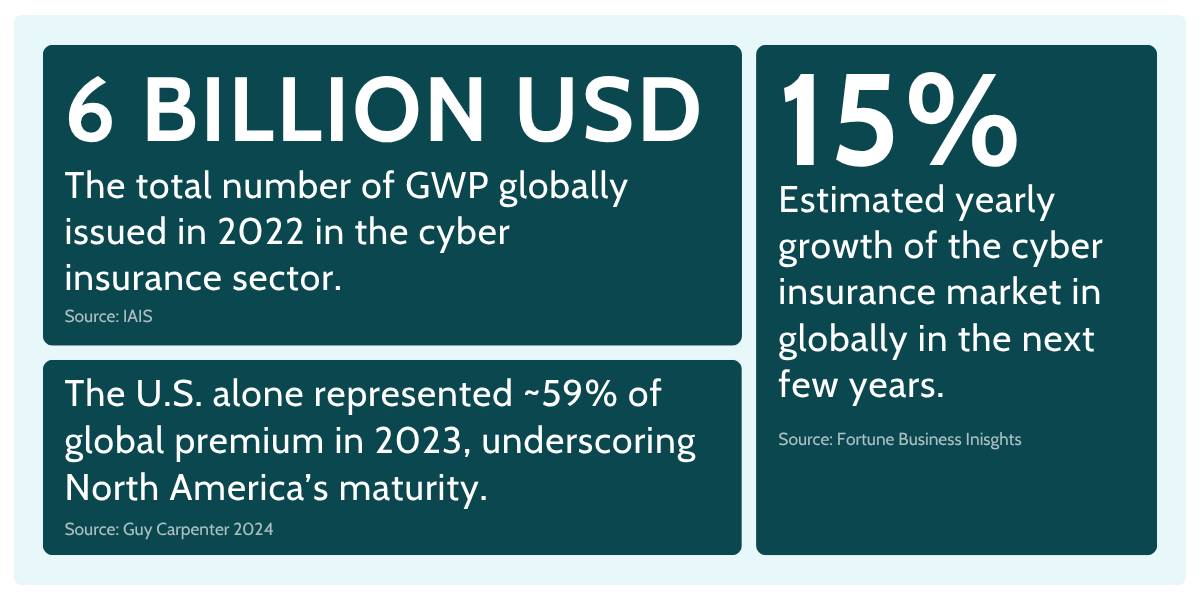
Growth accelerated in 2021, reaching US$13.7bn GWP (with a DWP sample of US$6.7bn; median US$74.9m per participating carrier). Market capacity was still highly concentrated - six insurers accounted for >80% of premium - so pricing power and wording standards were driven by a relatively small cohort of leaders.
By 2023, worldwide premiums were estimated at US$16.66bn, with the U.S. writing US$9.84bn (~59% of global). Policy adoption kept climbing: 4.37 million U.S. policies were in force, up 11.7% year over year, indicating that buyers were responding to persistent cyber attacks and contractual/board pressures even as rates began to moderate.
Forecasts past this point deserve scepticism. Published estimates for the same year have differed by more than 70% depending on methodology, so the two worth citing are the ones from people carrying the risk: Guy Carpenter sees the market reaching around USD 30bn by 2030, and Howden argues it could exceed USD 50bn by then if penetration widens.
Howden attaches a condition to its own number that is easy to miss. About 45% of cyber premium is ceded to reinsurers today, roughly USD 6bn, and reinsurance capacity would have to roughly triple to support a USD 50bn market without destabilising volatility. That forecast is a statement about reinsurance appetite as much as about buyer demand.
Longer-term scenarios remain bullish.
Howden argues premiums could exceed US$50bn by 2030, noting that roughly 45% of premiums are ceded to reinsurers today - about US$6bn - and that reinsurance capacity would need to triple to support that scale without destabilizing volatility from large cyber claims. Fortune Business Insights Cyber Insurance Report is more aggressive, projecting ~US$63bn by 2029.
2024 global premium split (Guy Carpenter): North America USD 10.5bn, Europe USD 3.9bn, APAC USD 1.7bn, Rest of World USD 0.5bn.
Four fifths of the market is in two regions
Cyber premium by region, 2024
Guy Carpenter
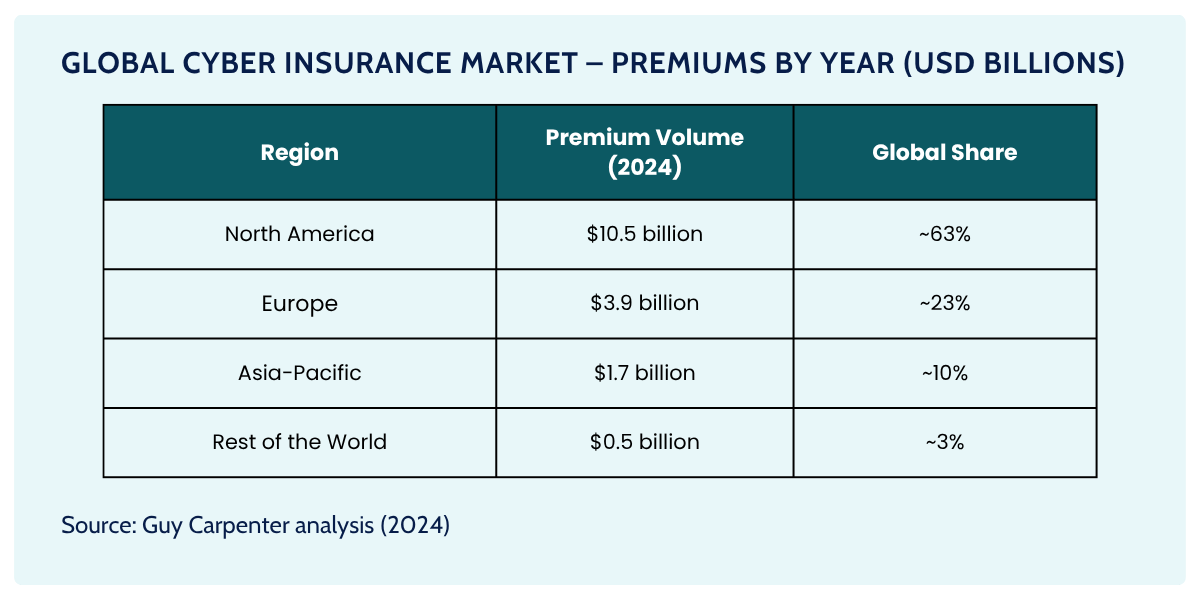
The U.S. alone represented ~59% of global premium in 2023, underscoring North America's maturity versus under-penetrated international regions.
Demand for cyber insurance is rising as boards and lenders react to headline cyber incidents, but uptake remains uneven: large enterprises buy broadly while SMEs lag.
Different industries buy and experience cyber risk very differently. Below is a crisp, scan-friendly view of who buys cyber insurance most, and where cyber claims hit hardest - combining the screenshot highlights with the PDF stats we used earlier.
Cyber remains a small but strategically important niche in P&C.
Conditions for buyers are the best they've been in years, which supports further adoption. Marsh reported cyber rates falling ~7% in Q2 2025 worldwide, with even larger decreases in Europe and Latin America. Despite softer pricing, carrier performance remains healthy: Howden finds average combined ratios around ~70% and about USD 9bn in underwriting profit across 2022–2024. Marsh's Q2 2026 index put the global cyber decline at 4%, part of a broader softening that has not reached casualty.
What softer pricing has not done is widen the buyer base. US policies in force rose to 4.37 million in 2023 and then stopped, holding roughly flat through 2024. Cheaper cover has mostly meant existing buyers paying less, not new ones arriving.
The 2025 claims picture, from Coalition's 2026 Cyber Claims Report, is more encouraging than the threat headlines suggest. Claims frequency rose 3% while severity fell 19%, taking the average loss down to US$116,000, and 64% of closed claims were resolved with no out-of-pocket loss for the policyholder at all.
Ransomware is where the shift is clearest. Initial demands jumped 47% year over year to more than US$1m, and a record 86% of affected policyholders refused to pay. Extortion has moved on accordingly: incidents combining data exfiltration with encryption made up 70% of ransomware claims in 2025 and cost roughly twice as much as encryption alone, averaging US$302,000.
Munich Re's 2026 cyber report is a useful counterweight to all of that. Nearly nine in ten C-level executives say they feel inadequately protected, and more than two-thirds of large organisations had a third-party security incident in the previous twelve months. Munich Re's own claims split 62% first-party to 38% third-party.
Capital support for systemic events is also improving, which is good news for long-term resilience.
Beazley now has about USD 510m of outstanding cyber catastrophe bonds and added USD 290m of cyber ILW protection, while Hannover Re renewed a USD 20m parametric cloud-outage cat bond. Cloud outage is one of the clearest cases of parametric triggers moving beyond catastrophe.
All in all, Howden's long-term view suggests cyber premiums could exceed USD 50 bn by 2030 if penetration rises (especially among SMEs and outside North America), while Swiss Re tempers nearer-term expectations to ~5% CAGR from 2023 given the current soft market.
Every figure above describes an ordinary year. Cyber's defining feature is that its bad year does not resemble its ordinary one.
Modelled global aggregation loss potential runs between US$20bn and US$46bn at a 1-in-200 year return period. Set that against annual premium of roughly US$16bn and the implied market loss ratios are 120% to 277%.
The bad year is bigger than the whole market
Modelled 1-in-200 aggregation loss against annual global premium, $bn
Aggregation modelling as compiled in this article’s sources; premium per Guy Carpenter
That risk stopped being theoretical in February 2024, when ALPHV ransomware got into Change Healthcare, the UnitedHealth subsidiary that clears a large share of US healthcare billing. The entry point, UnitedHealth chief executive Andrew Witty told a Senate committee that May, was a Citrix remote-access portal without multi-factor authentication: the exact control every cyber questionnaire in the market asks about.
One intermediary went down and payments froze across thousands of providers. UnitedHealth paid a $22m ransom, booked roughly $3.1bn of direct response costs through 2024, and later put the number of people affected near 190 million. One company’s response bill came to about a fifth of everything the global cyber market collects in a year.
Aggregation is not a modelling abstraction. It is a single unpatched portal at a single vendor that thousands of businesses turned out to be standing on.
That is why a line running at a 47% loss ratio still attracts underwriting caution. A single cloud provider, operating system or identity platform failing across thousands of insureds at once produces a correlated event with no real parallel in property or casualty. The October 2025 AWS outage and the 2024 CrowdStrike failure were rehearsals rather than the event itself.
Which makes the capital story more important than the pricing story. Beazley holds about USD 510m of outstanding cyber catastrophe bonds and added USD 290m of cyber industry-loss-warranty protection, and Hannover Re renewed a USD 20m parametric cloud-outage cat bond. Against a US$20bn to US$46bn tail, that is a start rather than an answer.
Before AI split the wordings, war did.
When the NotPetya malware spread in June 2017, Merck lost more than $1.4bn across tens of thousands of machines and claimed on its all-risk property programme, not a cyber policy. Its insurers, led by ACE American, invoked the hostile and warlike acts exclusion, arguing the attack was Russian state action against Ukraine and therefore war.
New Jersey’s courts disagreed twice, reading the exclusion as meaning physical warfare between armed forces, not malware. In January 2024, days before the state’s Supreme Court was due to hear the insurers’ final appeal with roughly $700m still in dispute, the parties settled on undisclosed terms.
The market did not wait for the courtroom. From March 2023 Lloyd’s required standalone cyber policies to carry explicit state-backed cyberattack exclusions, rewriting the wording rather than re-litigating it. Which is the pattern to notice: the most consequential changes in this line keep happening in the contract language, not the rate.
From 1 January 2026 the market stopped agreeing with itself about AI. Some carriers began excluding AI-generated deepfake fraud from standard social engineering cover, narrowing protection at renewal. Others went the other way and wrote it in: BOXX added affirmative AI and deepfake cover to its Cyberboxx Business policy, and Coalition launched a Deepfake Response Endorsement covering forensics, content takedown and crisis communications, priced at roughly US$500 to US$3,000 a year for small businesses.
Two buyers renewing in the same month can now end up on opposite sides of that line without either of them noticing. It is the same split playing out in general liability, where the standard forms moved to exclude generative AI in January 2026, and the same one behind the new wave of standalone AI liability products.
Cyber is the textbook example of a specialty line: fast-moving cyber threats, complex regulations, and outsized concentration risk.
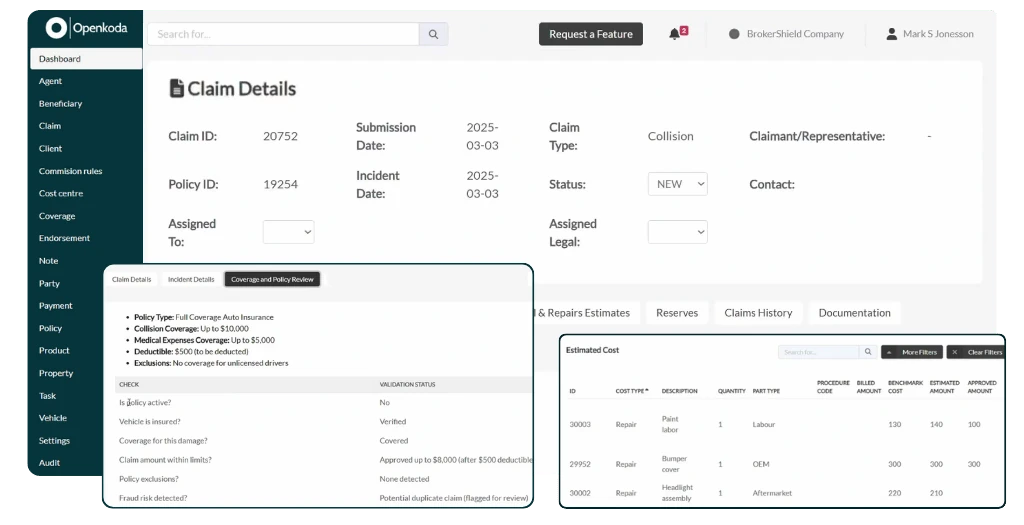
To compete, cyber insurance providers need systems that go beyond generic policy admin.

Underwriting depends on live security posture (e.g., MFA, EDR, incident-response readiness), external attack-surface signals, and portfolio-level accumulation controls - workflows that call for continuous data ingestion and modeling rather than one-time questionnaires.
There is also a timing problem specific to this line right now. Cyber wordings have now been rewritten three times in three years: for state-backed attacks after Merck, as accumulation limits tightened, and again when the market split over AI exclusions. A product you cannot re-cut in weeks is a product priced for last year's exposure.
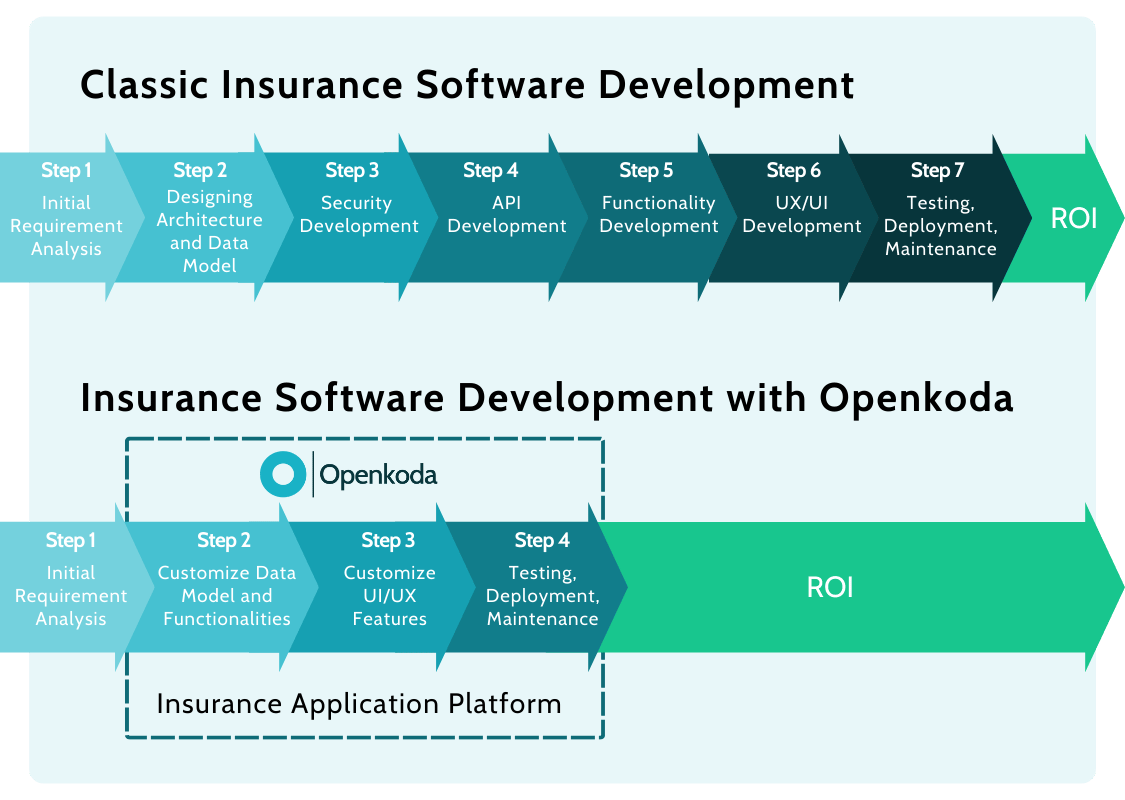
That is the gap Openkoda is built for, and the mechanism is configuration rather than code. Products, rating and rules are configuration a business user can open and change, not a codebase waiting on a release train.
The AI Product Builder takes a change described in plain English and returns a typed, reviewable change-set covering coverages, pricing, underwriting rules and workflow, with a before-and-after diff that applies only once somebody approves it. Adding a deepfake endorsement or a sub-limit for a named cloud provider is an afternoon and an approval, not a quarter.
Pricing follows the same idea. Rates, deductibles, limits, sub-limits, co-insurance and minimum premiums live in editable tables with effective dating, so a change can be tested and scheduled per class of risk rather than filed as a ticket.
Underwriting inputs arrive through the same integration layer as everything else: scanners, security-ratings feeds, threat intelligence, CAT models, payments, e-signature, broker systems and reinsurance reporting. For a line whose defining exposure is correlation, portfolio accumulation checks matter more than any single submission, and they need a live feed rather than a questionnaire answered once at bind.
Because the data model is open, entities like Assets, Controls, Incidents, Vendors and Third-Party Services can be extended without waiting for a vendor release, and you can run the whole platform in your own environment or on managed cloud with your products, rules and data exportable in full. Pricing is published and flat, with no per-seat charge and no percentage of premium, which matters in a line where premium per policy is currently falling.
For an insurer or MGA writing cyber, the pre-built capabilities that carry most of the weight are these:
The point of all of it is that a wording change, a new endorsement or a tightened accumulation rule is something your underwriting team can ship, review and roll back, rather than something that joins a development queue. In a line where the market rewrote its AI clauses in January and repriced itself downward across the same year, that is the difference between selling this year's product and last year's.
The line has matured, and 2024 is the year that showed what maturity looks like. Premium fell for the first time, policy count held, loss ratios stayed strong, and nobody left the market. That is a competitive line settling into a price, not a line in trouble.
Two questions this data cannot answer. Whether the 90% of companies that are SMEs, currently supplying about 30% of premium, ever buy at scale. And whether the reinsurance capacity behind a US$20bn to US$46bn tail arrives before the event that tests it.
An insurance CRM tracks clients, pipeline and renewals. It does not rate an endorsement or bill an installment. Six CRMs compared, and where the policy record lives.
UK MGAs wrote about £7.2bn of premium in 2025, up a fifth. Lloyd's, the FCA, the PRA and the capital behind MGAs spent the same year deciding how much of it to trust.

Surplus lines grew 10.4% in 2025 while filings outran premium in 2026. What specialty products ask of a PAS, and five tests to run before you buy one.
Book a live, personalized demo with our product team - tell us your use case and see the platform work with your data. No commitment.