Reporting & Dashboards
Answers in plain English, dashboards for every role
Ask a question about your book in plain language and get the report - with your data kept private. Role-based dashboards give executives, underwriting, sales, billing and ops the numbers that matter.
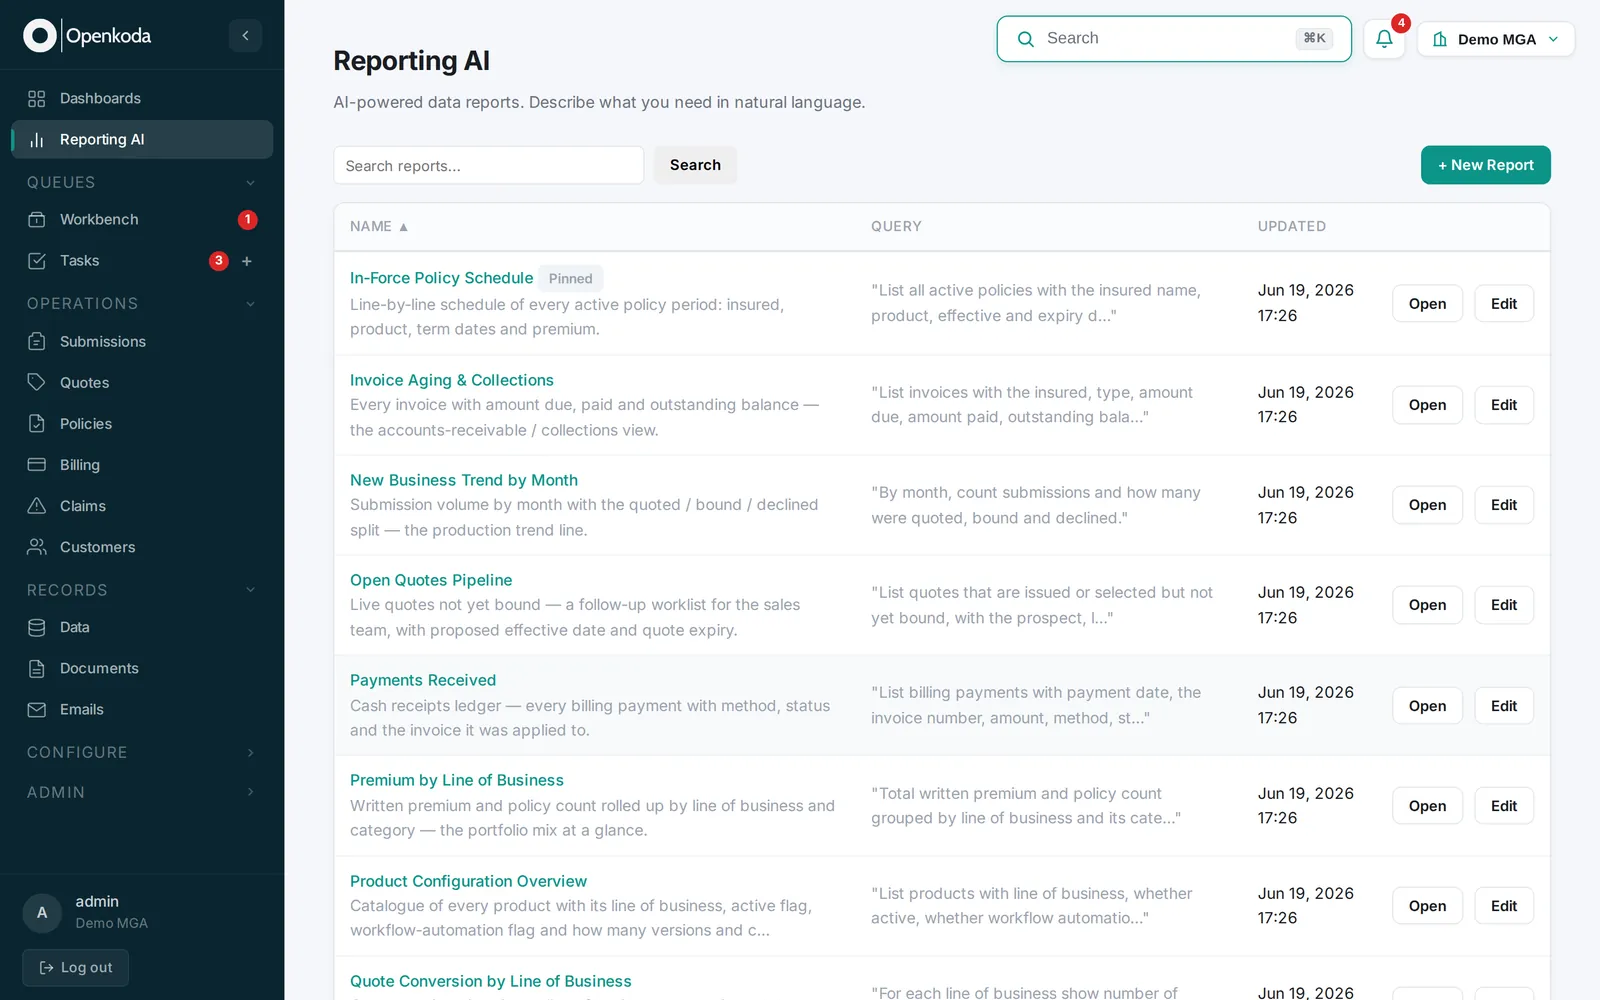
Answers in plain English
Ask a question about your book and get a report - no query language.
Your data stays private
Answers respect security and stay inside your system.
A dashboard per role
Exec, underwriting, sales, billing and ops each get the numbers that matter.
Insight without waiting on analysts
Everyone gets self-serve answers and a dashboard built for their job - no query language, no data exports, no delay.
What you can do
Answer your own questions, in seconds
Ask about loss ratio, retention or growth in plain English and get the report back, with the query shown. Nobody waits in an analyst queue to find out how the book is performing this month.
Give every role the numbers that matter to them
Executives, underwriting, claims, finance and operations each get a dashboard built for their job, rather than one shared report that everyone ignores. Decisions get made on current data.
Trust the numbers, and who can see them
Every query is scoped to your organization automatically, so reporting is safe to open up across the business. Insight spreads without creating a data-governance problem to solve later.
Everything your insurance business needs, in one platform
Natural-language reporting
Ask a question about your book in plain English and get a report back, with the query it ran shown alongside.
Tenant-safe by design
Every query is automatically scoped to your organization's data at the data layer, so answers never cross a tenant boundary.
Role-based dashboards
Configurable dashboards give each team - exec, underwriting, sales, billing, ops - the numbers that matter to them.
KPIs, charts & lists
Live metrics, trends and entity lists on one screen, so a dashboard answers the common questions at a glance.
Saved reports
Ready-made business reports, plus your own saved queries to reuse.
Excel export
Export any result to Excel to share it with the board or dig deeper in a spreadsheet.
Up and running, fast
Ask or pick a report
Plain-language question or a saved report.
See the answer
Results and charts, instantly.
Build a dashboard
Compose and share by role.
Answer a board question in seconds
An executive wants loss ratio by product for the quarter, before the meeting.
Ask in plain English
“Loss ratio by product, this quarter.”
Get the report
Openkoda returns the result, scoped to your data, with the query visible.
Pin to a dashboard
The exec saves it to the leadership dashboard for next time.
Illustrative example built on Openkoda's demo products.
Insurance Reporting Software for Your Team
Built for executives, managers and analysts who need answers without a data team. Each role gets a dashboard built for their job, and anyone can ask a question in plain English instead of joining an analyst queue.
Questions, answered
Do users need to know SQL?
Is our data kept private?
Can each team get its own dashboard?
Do we see the query the AI runs?
Can we save and export reports?
Which AI runs this, and where does our data go?
Can reporting draw on data from across the whole lifecycle?
See Openkoda in your context
Book a live, personalized demo with our product team - tell us your use case and see the platform work with your data. No commitment.