
Pet Insurance Statistics, Facts and Trends (2026)
Pet insurance is moving from niche to mainstream as vet bills climb and medical procedures become more advanced, driving double-digit growth in many markets.
This report distills the latest numbers and trends so you can see where the market is growing, what’s changing, and what matters most to pet owners right now.

Quick Outlook: Key Pet Insurance Statistics
- About 94 million households, or 71% of U.S. households, own a pet. (VetAdvantage)
- Global pet insurance premiums (2023): ~$10–12B; projected to reach $30–50B by 2030–2033 (mid-teens CAGR). (AlliedMarketResearch)
- Grand View Research states USD 25.70B in 2026 of Pet Insurance market size in 2026 (with USD 21.84B in 2025) (GMI)
- Total North American written premium surpassed $5.2B in 2024, +20.8% vs. 2023. (NAPHIA)
- North America GWP more than doubled from ~$2.0B (2020) to ~$4.7B (2024); recent ~20% YoY growth. (NAPHIA)
- Around 33% of pet owners in the United Kingdom have pet insurance. (PDSA)
Pet Insurance: Basics
Pet insurance is a type of specialty insurance that helps pet owners cover unexpected veterinary expenses. Policies typically reimburse for accidents, illnesses, and sometimes routine care, depending on the plan and provider.
Specialty insurance, by definition, focuses on tailored coverage for unique risks that don’t fall under the traditional life, health, property, or casualty lines.
Pet insurance is a great example of this.
It responds to a very specific need – protecting the financial health of households with pets – while addressing the emotional bond people have with their animals. For many, pets are family members, and owners increasingly want the same level of healthcare access and financial protection for them as they do for themselves.
From an insurance industry perspective, pet insurance sits at the intersection of consumer demand, rising veterinary costs, and digital distribution.

Pet Ownership in the United States and World
Pet ownership is widespread – and growing – across regions, but the mix and intensity vary by culture, income, and urbanization. The U.S. remains a high-ownership, multi-pet market where dogs and cats dominate household counts, while Europe shows similarly high penetration but stronger insurance uptake; emerging markets are expanding fastest as rising incomes, e-commerce, and veterinary access improve.
US Ownership Statistics
The U.S. is one of the largest pet markets in the world, both in terms of the number of households with pets and overall spending. This makes it a central driver of demand for pet insurance.
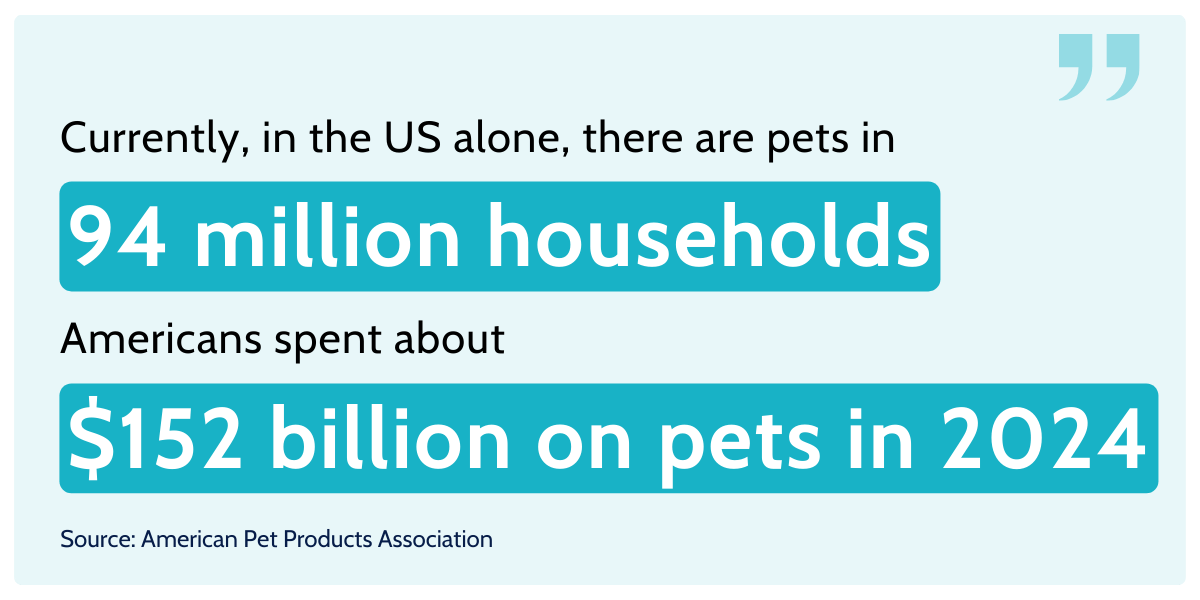
- Households owning a pet: About 94 million households, or 71% of U.S. households, own a pet (American Pet Products Association)
- Households with dogs: ~ 68 million households (American Pet Products Association)
- Households with cats: ~ 49 million households (American Pet Products Association)
- Other pets: Birds ~ 6M households, reptiles ~ 6M, freshwater fish ~ 10M, small mammals ~ 6M, horses ~ 2M, saltwater fish ~ 2M (American Pet Products Association)
- Dog and cat population trend: U.S. dog insurance increased from ~ 52.9M in 1996 to ~ 89.7M in 2024; total dogs + cats in households now ~ 163.5M (AVMA)
- Pet industry spending: Americans spent about $152 billion on pets in 2024 (Insurance Information Institute)
Global Ownership Statistics
Worldwide, pet ownership is on the rise, fueled by urbanization, higher disposable incomes, and the humanization of pets.
While the U.S. is a leader, countries in Latin America, Europe, and Asia are also major contributors.
- Global pet population: Around 1 billion pets globally, across all categories (Global Pet Industry)
- Dogs worldwide: ~ 900M pet dogs (The Zebra)
- Cats worldwide: ~ 370M pet cats (The Zebra)
- Households with pets worldwide: About 33% of households globally own at least one pet (The Zebra)
- Regional concentration: The U.S., Brazil, the EU, and China together account for over half a billion dogs and cats (Health for Animals)
Ownership Demographics
To understand who owns pets, it helps to look at generational breakdowns. These figures show which age cohorts form the largest share of pet owners in the U.S., which can inform product targeting, marketing, and underwriting strategies.
- Millennials make up about 32% of all U.S. pet-owning households, making them the largest generational group among pet owners. (Rainwalk Pet Insurance)
- Baby Boomers account for approximately 27% of pet owners in the United States, placing them close behind millennials in terms of ownership share. (Rainwalk Pet Insurance)
- Generation X represents about 24% of all pet owners in the U.S., making it the third largest generational cohort in pet ownership. (Rainwalk Pet Insurance)
Pet Ownership Statistics by Species
These statistics show how pet ownership breaks down by species in U.S. households.
Understanding species prevalence helps insurers tailor risk models, pricing, and product offerings.
- About 45.5% of U.S. households are dog owners, making dogs the most common pet species in American homes (AVMA).
- Approximately 32.1% of U.S. households are cat owners, placing cats as the second most prevalent species among pets (AVMA).
- Birds are owned by about 1.6% of U.S. households, a much smaller share compared to dogs or cats (AVMA)
(Read also: Embedded Insurance Statistics and Market Dynamics (2026))
Pet Health Insurance Plans Examples
When covering the pet insurance market it is worth exploring what kinds of insurance plans do carriers offer.
The exact problems that are covered by pet insurance depend on what type of pet insurance plan you buy.
There are generally two types of plans:
- Accident and illness plan: This is the broad coverage option. It costs more but protects against both injuries and sickness.
- Accident-only plan: This is the budget option. It helps with sudden accidents but not diseases.
| Plan type | What it generally covers | What it generally does not cover |
|---|---|---|
| Accident & Illness |
|
|
| Accident-Only |
|
|
Across the mature pet insurance market, typical premiums cluster in a fairly tight band: in North America, the latest NAPHIA data shows average monthly accident-and-illness premiums of about $62 for dogs and $32 for cats, a practical proxy for the going rate of pet health insurance in 2026.
In the UK, where the pet insurance sector is particularly developed, the Association of British Insurers reports an average annual premium of ~£389 in 2024—useful as a benchmark when comparing plans or budgeting.
These sticker prices sit against rising veterinary costs and robust pet insurance claims activity – ABI members paid out around £1.23 billion in 2024 alone – underscoring how even mid-tier policies can offset the financial shock of surgery or chronic-care bills.
For shoppers, that means focusing less on the headline price and more on coverage depth (accident-only vs. accident-and-illness), reimbursement levels, deductibles, and annual limits, since those levers move the premium more than any single “average.”
In short, expect to pay roughly $30–$65 per month for mainstream U.S. coverage (lower for many cats, higher for older or purebred dogs), or around £389 per year in the UK – figures that help frame value when weighing today’s premiums against tomorrow’s potential claims.
Pet Insurance Market Statistics
Global pet insurance is scaling quickly – powered by humanization of pets, rising vet costs, and broader availability of digital, embedded, and employer-offered plans.
North America is posting double-digit growth off a still-low base, Europe remains the penetration leader, and long-term forecasts point to sustained expansion as awareness rises and products diversify beyond traditional accident-and-illness coverage.
- North America hit 7.03 million insured pets at YE 2024, up 12.2% YoY from 6.25 million in 2023. (NAPHIA)
- U.S. written premium reached $4.7B in 2024, +21.4% YoY; Canada hit C$583.9M, +20.7% YoY. (NAPHIA)
- Total North American written premium surpassed $5.2B in 2024, +20.8% vs. 2023. (NAPHIA)
- Global market size $18.6B (2024), projected $79.6B by 2033 (CAGR ~17.6%). (Grand View Research)
- Europe market size $7.62B (2024), forecast ~15.5% CAGR to 2030. (Grand View Research)
- Roughly ~4% of U.S. dogs and ~1% of cats are insured in the US. (MarketWatch)
- In the United States, seen approximately 3% pets insured in 2020. (MarketWatch)
- Around 33% of pet owners in the United Kingdom have pet insurance. (MarketWatch)
- In Sweden, the penetration rate for pet insurance is as high as 50%. (AAHA)
- According to a survey conducted in the United States, around 68% of pet owners were aware of pet insurance in 2020. (MarketUS)
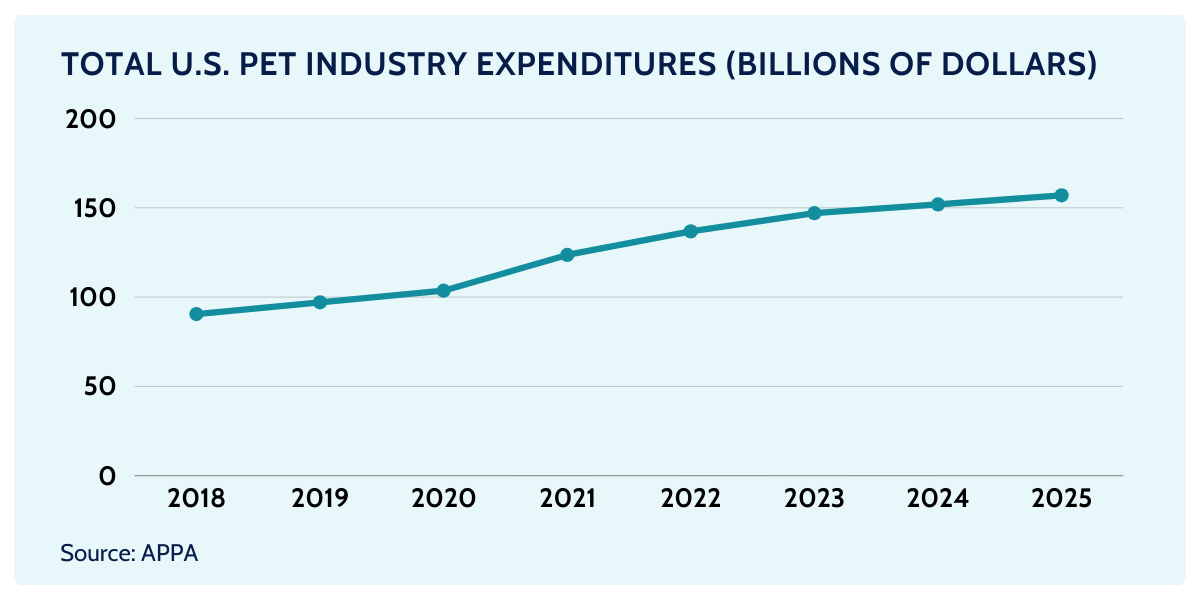
Total U.S. Pet Industry Expenditures, 2016-2026
U.S. pet industry expenditures nearly doubled from $66.8B in 2016 to $152B in 2024, a gain of about $85B in eight years. That translates to a ~10.8% CAGR (2016–2024) – a striking long-run expansion for a mature consumer category.
The pandemic era marked a clear inflection. Spending jumped from $103.6B in 2020 to $123.6B in 2021, reflecting both higher pet adoption/ownership and trading-up in food, treats, and veterinary care.
APPA reports 2024 actual at ~$152B and expects ~$157B in 2025, implying continued, moderate growth as households prioritize pet health and quality despite tighter wallets. A reasonable extrapolation from APPA’s 2024–2025 trajectory suggests total U.S. pet industry expenditures could reach approximately $162.3B in 2026 (estimate).
What are the Average Pet Expenditures?
Average U.S. pet expenditures vary a lot by species, life stage, and whether you carry insurance – but a few benchmarks anchor the range: the typical U.S. household spent about $876 on pets in 2023, while dog and cat owners commonly see four-figure annual totals once food, routine vet care, and services are added.
- Industry report that the estimated first-year cost of ownership ranges from $1,300 to $2,800 for dogs and $960 to $2,500 for cats. (Synchrony)
- Estimated spending on veterinary care and related products (excluding food and treats) reached $32.3 billion in 2021, up from $31.4 billion in 2020. (DVM360)
- Average household pet spending increased by $135 year over year from 2022 to 2023, rising from $741 to $876, highlighting both inflationary effects and ongoing premiumization. (MarketWatch)
- Consumer spending on pet medical care has increased every year since 2001, indicating a long-term upward trend in healthcare outlays for companion animals. (FRED)
- The total number of insured pets in the U.S. rose to 5.3 million in 2022, up from 3.1 million in 2020, reflecting rapid adoption of pet insurance. (MakretUS)
- Dogs account for 80.1% of insured pets, while cats account for 19.9%, underscoring a dog-heavy insurance mix. (NAPHIA)
- As companion animal lifespans increase, consumers should expect veterinary care costs to rise, driven by greater utilization and age-related medical needs. (BanfieldExchange)
- Lifetime ownership costs are estimated at $22,125–$60,602 for dogs and $20,073–$47,106 for cats, depending on care choices and longevity. (Synchrony)
- In the U.S., 92.8% of insured pets are covered by Accident & Illness or embedded wellness plans, 7.0% carry endorsements (e.g., wellness or cancer coverage), and 0.2% are Accident-Only, reflecting strong preference for comprehensive policies. (Insuranceopedia)
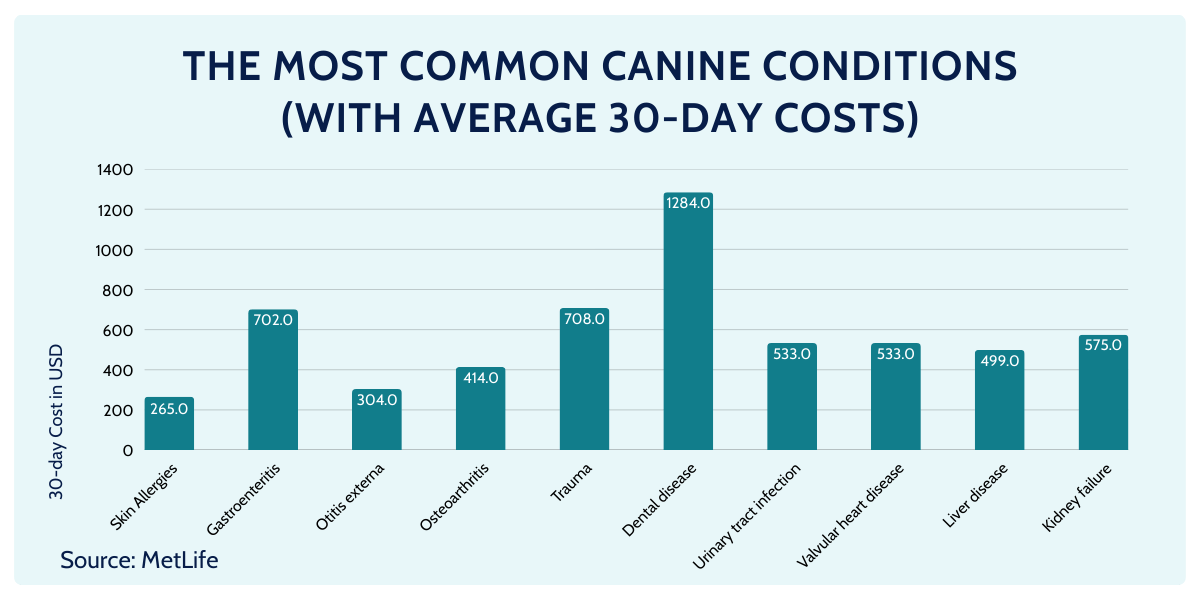
The Most Common Canine Conditions (With Average 30-day Costs)
MetLife has compiled costs associated with veterinary care for dogs. These figures highlight the routine – but often underestimated – cost of managing frequent canine ailments over a typical 30-day treatment window.
- Skin allergies — $265
- Gastroenteritis — $702
- Otitis externa (ear infections) — $304
- Osteoarthritis — $414
- Trauma — $708
- Dental disease — $1,284
- Urinary tract infection — $533
- Valvular heart disease — $553
- Liver disease — $499
- Kidney failure — $575
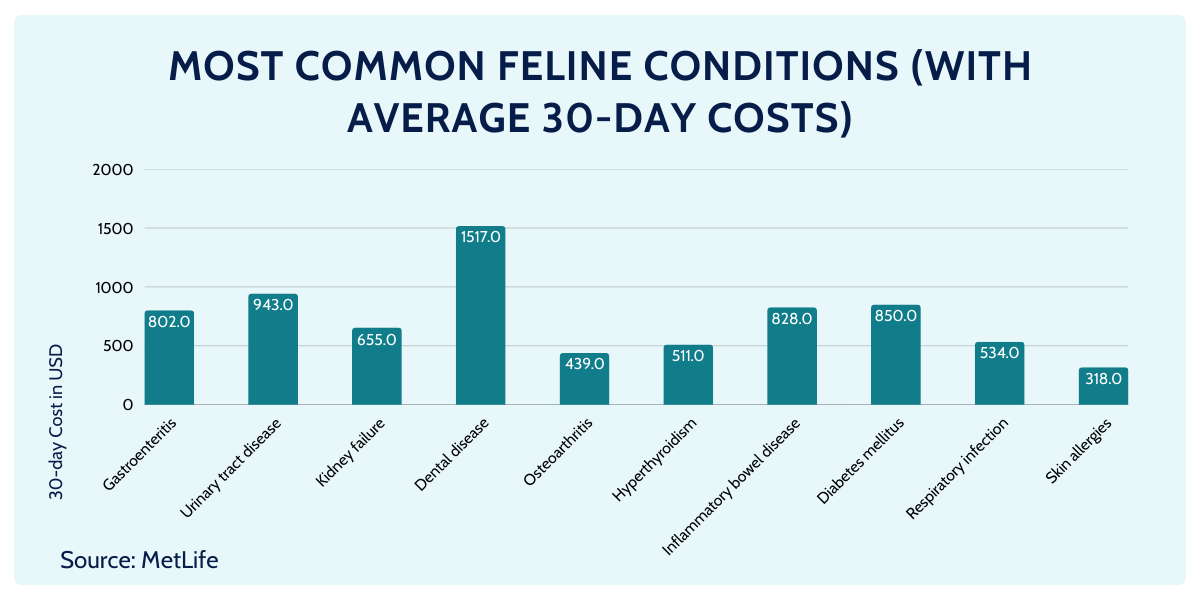
Most Common Feline Conditions (With Average 30-day Costs)
Cats face a similar blend of chronic and acute conditions, with urinary tract disease, gastrointestinal issues, and dental disease driving some of the highest short-term outlays.
- Gastroenteritis — $802
- Urinary tract disease — $943
- Kidney failure — $655
- Dental disease — $1,517
- Osteoarthritis — $439
- Hyperthyroidism — $511
- Inflammatory bowel disease — $828
- Diabetes mellitus — $850
- Respiratory infection — $534
- Skin allergies — $318
First Pet Insurance Policy
The modern story begins in Scandinavia: in the late 19th and early 20th centuries Sweden experimented with animal cover, and by 1924 the first pet insurance policy issued for a dog is recorded there – often cited as the starting pistol for companion-animal policies.
In the United States, the market’s defining moment came much later and much louder: in 1982, Veterinary Pet Insurance (VPI) issued the first U.S. pet insurance policy to Lassie, the famous TV collie. That single pet insurance policy issued to a cultural icon doubled as a mass-market education campaign—demonstrating how insurance could offset rising veterinary bills and legitimizing the category for veterinarians and pet owners alike.
Building Systems for Specialty Insurance Industry
Pet insurance is a textbook case of specialty insurance: narrowly focused coverage with unique underwriting, benefits, and servicing rules—and it’s expanding far faster than mainstream P&C.
In North America, written premium hit ~$5.2B in 2024 (+20.8% YoY) with 7.03 million pets insured, while the global market is estimated at $18.6B (2024) and projected to reach ~$79.6B by 2033 (≈17.6% CAGR).
By contrast, overall insurance premium growth is in the low single digits globally, underscoring the outperformance (and complexity) of specialty niches like pet.
Specialty insurers need software platforms that are highly configurable, fast to iterate, and free of vendor lock-in so they can pilot micro-variants, plug in new data sources, and scale without rewriting the core.
Openkoda is a core application platform built to ship insurance products ~60% faster with full code ownership and no proprietary lock-ins.

It provides pre-built templates for policy management, claims management, embedded insurance, AI reporting, and API insurance integrations so teams can stand up new products quickly, then tailor rating, forms, and workflows for each niche.
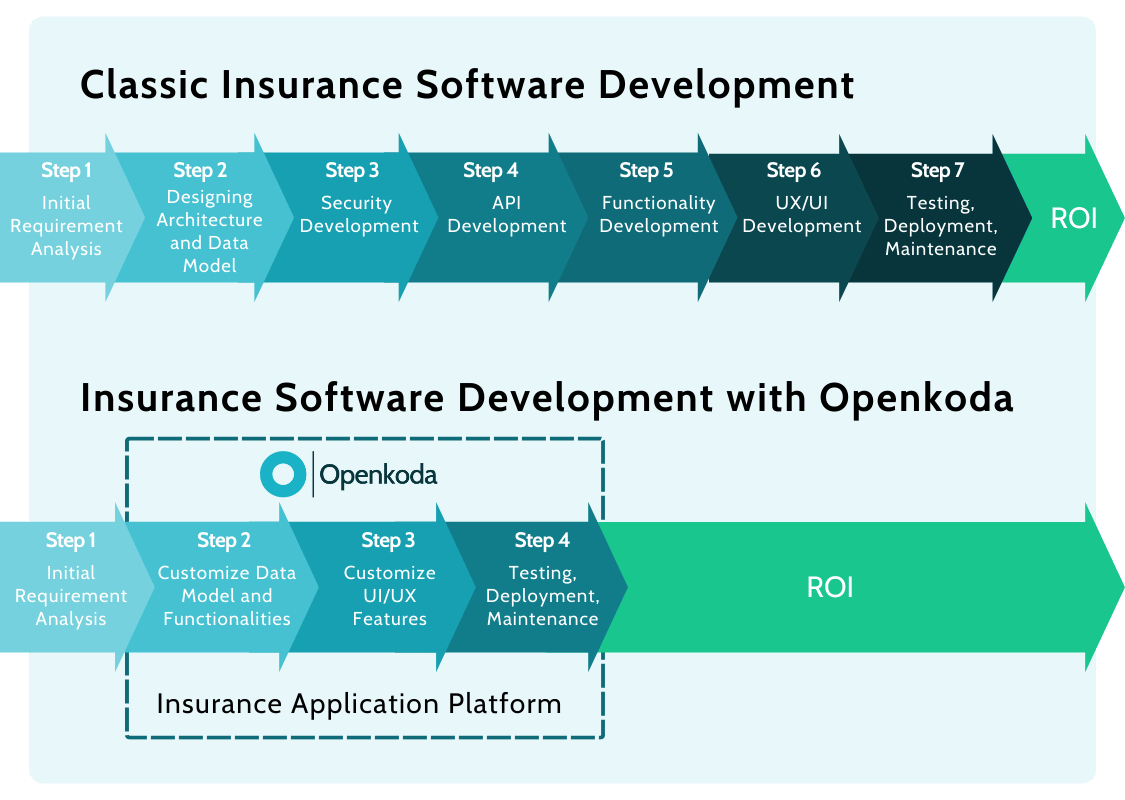
Openkoda’s solid insurance application core gives pet insurance providers a tools for:
- Rapid insurance product launch: Launch A/B variants of deductibles, coinsurance, wellness add-ons, and embedded checkout flows in weeks, not quarters.
- Rule-rich underwriting & forms: Model breed/age factors, waiting periods, congenital exclusions, and sub-limits as editable rules—not hard-coded logic.
- Claims automation & evidence intake: Orchestrate FNOL, document upload, triage, and straight-through decisions; feed AI reporting to spot leakage and refine benefits.
- Open integrations: Connect to vet practice systems, payment providers, CRM, rating engines, and tele-vet partners via configurable connectors.
Put simply: specialty lines like pet insurance are growing much faster than the broader market, but they require agile, configurable technology.
Closing Thoughts
As vet bill totals rise alongside more advanced medical procedures for pets, owners are seeking clearer protection and faster claims.
Specialty insurance – especially pet – will keep expanding, rewarding carriers that can iterate products and embed coverage where decisions happen.
With Openkoda, insurers gain the flexibility to launch and refine these offerings quickly while retaining full control over data, rules, and user experience.
&p[summary]=2026 pet insurance statistics: costs, growth, and trends shaping how owners handle rising vet bills.)