
Car Insurance Statistics and Facts (2026)
Car insurance premiums in the U.S. have jumped sharply in recent years, and 2026 finds many drivers still trying to keep essential auto insurance coverage without blowing their budgets.
In this guide, we’ll walk through the latest car insurance statistics to show how prices vary by state, age, vehicle type, and coverage choices.
Key Car Insurance Statistics
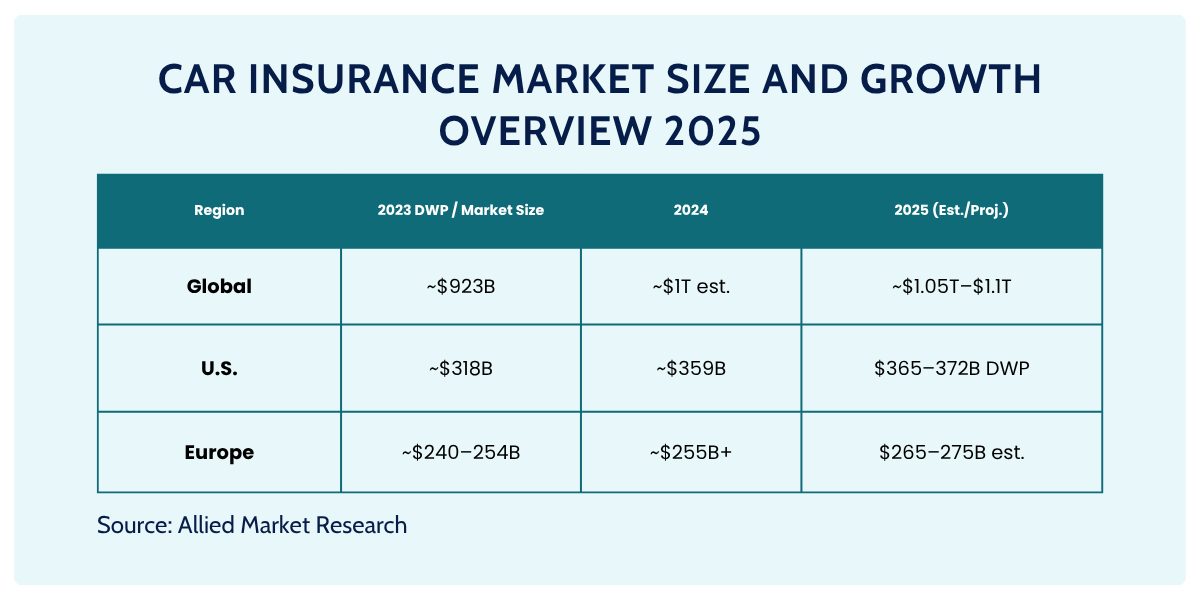
- The global motor/car insurance market was valued at USD 911.64 billion in 2024 and is forecast to reach USD 1.69 trillion by 2033 (CAGR 7.1% from 2025–2033). (IMARC)
- In the U.S., the average annual cost of full coverage car insurance in 2026 is about USD 2,671, up nearly 12% from the previous year. (Kiplinger)
- In the UK, average private motor premiums in 2023 were 25% higher than in 2022 (annual averages £543 vs £434). (ABI)
- U.S. premium levels vary widely by state: recent analysis shows average full coverage costs of about $902 in Vermont, $2,912 in Florida, and $4,031 in New York. (WashingtonPost)
Auto Insurance Sector: 2026 Overview
At its core, auto insurance is a contract: you pay a premium, and in return the insurer agrees to pay for certain losses if you cause an accident, get hit, or your car is damaged or stolen.
From an industry perspective, what most of us think of as “car insurance” is personal auto coverage for private passenger vehicles—the cars, SUVs and pickups people use to commute, run errands, and drive their families around. This private passenger segment dominates the U.S. insurance landscape: NAIC market-share data show that private passenger auto insurance generated about $344.112 billion in direct premiums written in 2024, roughly one-third of all property-casualty premiums written that year. (NAIC – 2024 Market Share Data)
Looking at last year’s figures Coherent Market Insights estimates the global vehicle insurance market will reach about USD 1.08 trillion this year, rising to nearly USD 1.9 trillion by 2032 at an 8.4% CAGR.
A broader definition used by Mordor Intelligence puts the global motor insurance market at around USD 2.17 trillion in 2026, with premiums projected to climb to USD 2.95 trillion by 2030 and grow at roughly 6.7% annually.
The Federal Insurance Office’s 2025 report on personal auto markets underscores this pressure.
It notes that personal auto insurance premiums reached about $344.112 billion in 2024 and accounted for 35.8% of the U.S. property-casualty market, and that premiums for minimum required liability coverage (FR-limits policies) increased from an average of $416 in 2015 to $550 in 2022, even as accident frequency fell and loss severity rose. (Repairer Driven News – Summary of FIO Personal Auto Report)
NAIC data show that the average expenditure per insured vehicle climbed 14.41% in 2023 alone, to about $1,282, while overall auto insurance rate levels increased roughly 35% from early 2022 through the end of 2024. (NAIC – 2023 Auto Insurance Database Supplement)
For many lower-income drivers, rising car insurance premiums are pushing them toward lower limits or even dropping coverage altogether.
That’s showing up on the road.
FIO cites data that about 14% of drivers did not maintain legally required coverage car insurance in 2022, and other research finds that roughly one-third of U.S. drivers in 2023 were either uninsured or underinsured.
Factors That Affect Car Insurance Rates
Insurers don’t pull a number out of thin air.
Behind every quote is an actuarial model weighing dozens of variables – some clearly related to risk (like accident history) and others more controversial (like credit score or education level).
The Federal Insurance Office notes that insurers routinely use “proxy factors” such as age, credit history, education levels, gender and marital status in personal auto underwriting, and that state regulators are actively re-examining whether all of these should be allowed.
Main factors for calculating the price of full coverage car insurance include:
- Driving history and claims
- Age and driving experience
- Location and garaging ZIP code
- Vehicle type, value and repair cost
- How you use the car
- Coverage choices and deductibles
- Credit-based insurance scores
- Market-level forces outside your control
(Read also: 2026 Cyber Insurance Statistics and Trends)
U.S. Average Annual Auto Insurance Premiums
Looking at full coverage auto insurance across the U.S., the gap between states is striking. According to Experian’s 2025 state-by-state analysis, the national average auto insurance premium is about $2,320 per year, but state averages range from just $1,005 in Vermont to a steep $4,264 in Maryland for comparable full coverage policies. (Experian)
These differences in auto insurance prices are not random. Research from ValuePenguin and others shows that state-level regulation and legal frameworks, minimum coverage requirements, population density, accident and crime rates, and the likelihood of severe weather events all have a major impact on what insurers charge.
On top of that, recent inflation dynamics have put extra pressure on drivers. The consumer price index (CPI) data show that the motor vehicle insurance component has risen faster than overall inflation in recent years: for example, motor vehicle insurance costs were about 2.7 times higher than the nationwide inflation rate in May 2024, and were still rising noticeably faster than the overall CPI into 2025. (USAFacts)
Together, these trends explain why full coverage auto insurance has become a major budget item in some states and why monitoring both state-level risk factors and national CPI trends is now essential when talking about long-term auto insurance affordability in the U.S.
Average Car Insurance Rates by Age and Gender
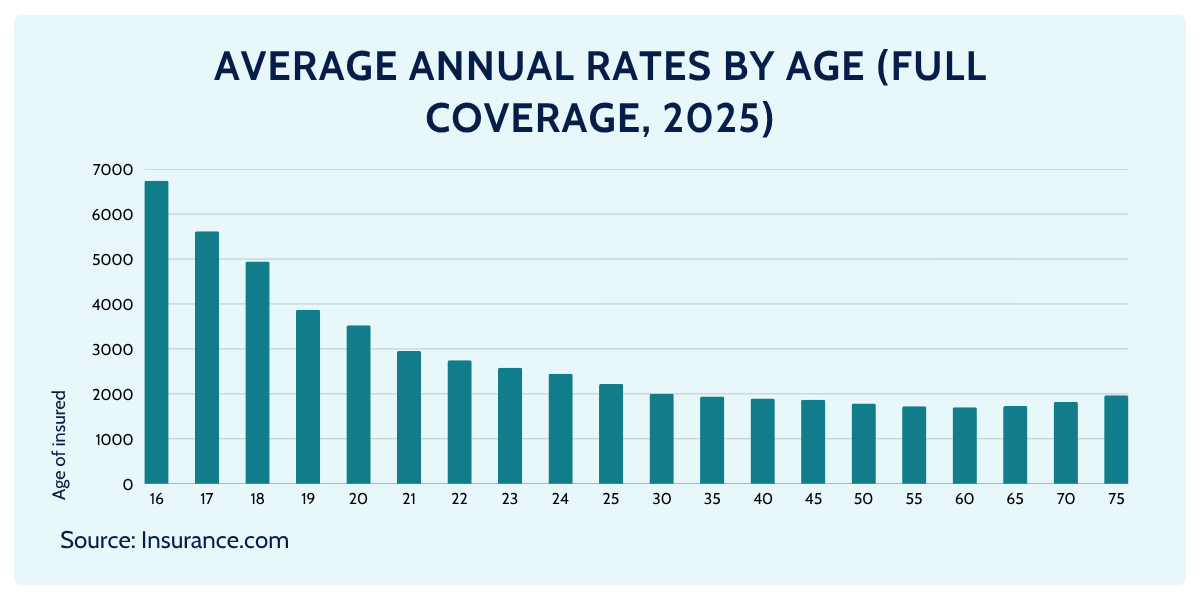
For average annual rates by age and gender, recent US data on full-coverage auto insurance shows that the average cost is highest for teenage drivers, especially 16–18-year-old males, whose automobile insurance can exceed $7,500 per year, while same-age females pay slightly less on average.
Prices then fall steadily through the 20s and reach their lowest levels for drivers in their 40s and 50s before rising again for drivers in their mid-70s, reflecting higher risk at both ends of the age spectrum.
These figures refer to “full coverage,” which typically combines liability insurance with comprehensive coverage and collision protection (Insurance.com)
(Read also: Embedded Insurance Statistics and Market Dynamics (2026))
Influence of Age on The Cost of Auto Insurance Premiums Overview
- Teens pay the most, especially 16–18-year-olds:
- 16-year-old male: ~$7,530/year
- 16-year-old female: ~$6,742/year
- Gap shrinks with age:
- At 40, the difference is basically $1/year (negligible).
- Seniors pay more again:
- By 75, male drivers are back up around $2,046/year, females $1,969/year.
Gender Differences by Age (2026, Monthly View)
Looking at gender differences by age on a monthly basis, the average cost of comprehensive coverage plus liability insurance in a full auto insurance package is markedly higher for young men than for young women: at 16, male drivers pay around $478 per month versus $436 for females, with the gap shrinking through the early 20s and becoming almost negligible by age 30–60.
By age 75, the difference widens slightly again, with men paying a bit more than women for similar automobile insurance profiles (MoneyGeek).
- 16–17: about $419/month on average
- 18–19: about $280/month (≈33% lower than 16–17)
- 20–25: about $152/month
- 26–30: about $110/month
- 31–50: about $101/month
- 65+: about $125/month (≈32% higher than middle-aged drivers)
How Much Does Gender Really Matter for Car Insurance in 2026?
Overall, how much gender matters in auto insurance pricing is modest compared to age: auto insurers charge substantially more to young men than young women and somewhat more to older men than older women, but for most adult drivers the gender effect is small.
Apparent discrepancies between published figures (for example, in the teenage brackets) arise because different studies assume different coverage limits and deductibles, as well as different vehicles and rating assumptions, even though all are describing full, comprehensive coverage plus liability insurance for automobile insurance customers.
(Read also: Life Insurance Statistics and Trends (2026))
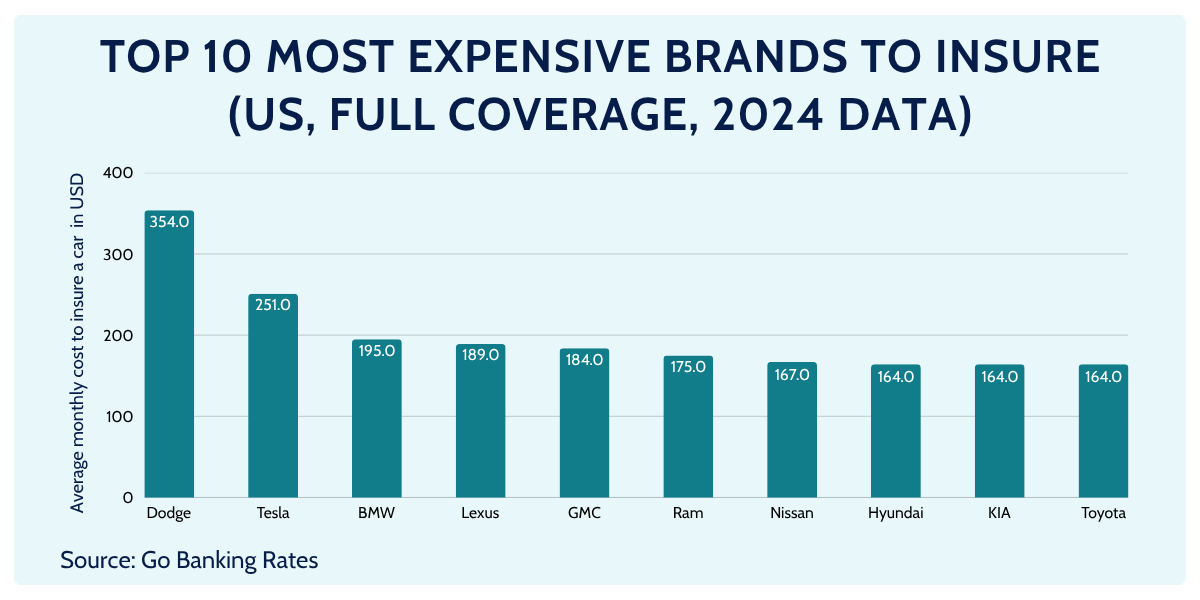
Most Expensive Car Brands to Insure
In both the US and Europe, the most expensive car brands to insure are typically high-value or performance marques. Recent US data show Dodge averaging about $354 per month (~$4,242/year) for full coverage, while Tesla averages around $251/month (~$3,007/year) (MarketWatch Guides dataset).
Other consistently pricey US brands include Maserati (~$238/month), Porsche (~$207/month), BMW (~$195–204/month) and Mercedes-Benz (~$202/month) (Compare.com).
In Europe 2026 data put the Porsche Taycan at about £950/year, the Porsche Panamera at £940/year, and models from Mercedes-Benz, Land Rover, Tesla, Audi and Toyota clustered in the £840–£900/year range, keeping these brands at the top of the “most expensive to insure” lists on both sides of the Atlantic (Go.Compare)
Examples of Very Expensive Individual Models (US)
Model-level rankings reinforce the brand picture:
- Car and Driver’s 2024 list of the most expensive cars to insure includes several Maserati, Porsche, BMW and Tesla models at ≈$4,000–$5,200/year for full coverage (e.g. Maserati Quattroporte ≈$5,176/year; Porsche Taycan Turbo S ≈$4,028/year; Tesla Model S Plaid ≈$4,115/year). (Car and Driver)
- A recent Bankrate-based summary notes that high-end models like Tesla Model X/S Plaid, Dodge Charger, Lexus RC F and Audi RS performance variants can be more than double the typical US full-coverage premium, depending on trim.
Why these brands are so expensive?
- Dodge, BMW, Lexus, GMC, Ram – high-performance or heavy vehicles → higher crash severity and repair costs. (ameriguardinsurance.com)
- Tesla – very expensive bodywork and electronics, limited repair network, EV parts → high collision/comprehensive claim costs. (ameriguardinsurance.com)
- Hyundai & Kia – theft waves in the US (easy-to-steal pre-immobilizer models) keep comprehensive claims high.
(Read also: Pet Insurance Statistics, Facts and Trends (2026))
Closing Thoughts
Car insurance statistics aren’t just numbers on a page – they reveal how economic trends, repair costs, and driver behavior translate into the car insurance premiums you pay.
By understanding the main risk factors and how insurers price private passenger coverage, drivers can choose limits and options that protect them without overpaying.
&p[summary]=2026 car insurance statistics reveal average premiums and market trends across all U.S. states.)