
Life Insurance Statistics and Trends (2026)
The life insurance market is evolving fast: rates have reset, product economics have shifted, and customers are rethinking how much protection they actually need.
This article distills the latest market picture, who owns coverage (and who doesn’t), how costs stack up, and what’s changing in product design and distribution.
Our goal is simple – give you a clear, practical view of life insurance today so you can make better decisions tomorrow.

Life Insurance Key Statistics
- 42% of U.S. adults—about 102 million people—say they need life insurance or more of it, and 37% plan to buy within 12 months (LIMRA)
- The global mortality protection gap stands at roughly $414 billion per year in premium-equivalent terms, highlighting how far coverage still falls short (Swiss Re)
- U.S. life/annuity insurers wrote about $1.08 trillion in direct premiums in 2024—underscoring the scale of the world’s largest life market (U.S. Treasury FIO)
- A healthy 40-year-old can often secure $500,000 of 20-year term life insurance for about $26 per month, a price point many consumers still overestimate (NerdWallet)
- Only 28% of UK adults report having a life insurance policy, revealing a sizable protection opportunity in a major European market (FCA Financial Lives 2024)
State of Life Insurance market in 2026
After two years of unusually strong growth, life insurance industry heads into 2026 as the largest slice of the global insurance pie and with solid (if moderating) momentum.
In 2024, life premiums climbed to about €2.9 trillion (~$3.1T) within a €7.0 trillion global insurance market, making life the single biggest segment worldwide (Allianz Global Insurance Report 2025).
Looking ahead, industry growth cools from “sprint” to “steady jog.”
Swiss Re’s latest outlook provides 2025F and 2026–27F growth rates, including a dedicated life line: global life premium growth 2.2% (2025F) and 2.5% (2026–27F), and total premiums 3.1% (2025F) and 2.3% (2026–27F) (Swiss Re sigma 2/2025).
Regional picture (what drove 2025—and sets the tone for 2026)
- North America: A surge in annuity demand pushed life direct premiums written growth to ~+14% in 2025, an “astonishing” upswing as consumers locked in higher yields. The U.S. remained the world’s largest life market, with life/annuity direct premiums around $1.08T in 2025. (Allianz Global Insurance Report 2025)
- Western Europe: Nominal life direct premiums written advanced roughly +7% in 2024 as higher rates revived guaranteed-savings products and investment returns (Allianz Global Insurance Report 2025).
- Asia-Pacific: Now responsible for over one-third of global life premiums, with China rebounding ~+15% in 2024 on strong savings sales; the region is expected to contribute over half of incremental life premiums over the next decade (Allianz Global Insurance Report 2025).
Bottom line for 2026: higher rates have reset product economics in life insurance, lifting profitability and demand for savings-oriented policies; growth should remain positive, though less “hot” than 2023–2024. That sets the stage for how and what consumers are actually buying—our next section.
Life Insurance Sales Breakdown
The sales mix has been shifting, especially in the U.S. (the world’s largest individual life market). Here’s the 2024 product breakdown by share of new premiums in the U.S.—a useful proxy for advanced markets:
- Whole life: ~36% of premiums—still the largest single product, favored for guarantees and level premiums. (Top Life Insurance Statistics of 2025)
- Term life insurance: ~19%—the value leader for pure protection during working years. (Top Life Insurance Statistics of 2025)
- Universal life (fixed): ~7%—lifetime cover with flexible premiums and credited interest. (Top Life Insurance Statistics of 2025)
- Indexed UL (IUL): ~24%—continued momentum as buyers seek upside with downside floors; IUL new premium hit a record ~$3.8B in 2024. (Top Life Insurance Statistics of 2025)
- Variable UL (VUL): ~14%—chosen by more risk-tolerant buyers for market-linked growth. (Top Life Insurance Statistics of 2025)
Business Segments: Group vs. Individual Life Insurance
Most life premium globally still comes from individual policies (ordinary life). In mature markets like the U.S., individual life typically accounts for ~80% of life insurance premiums, with group coverage a smaller (but important) slice—mainly employer-provided term life. (Facts + Statistics: Life insurance | III)
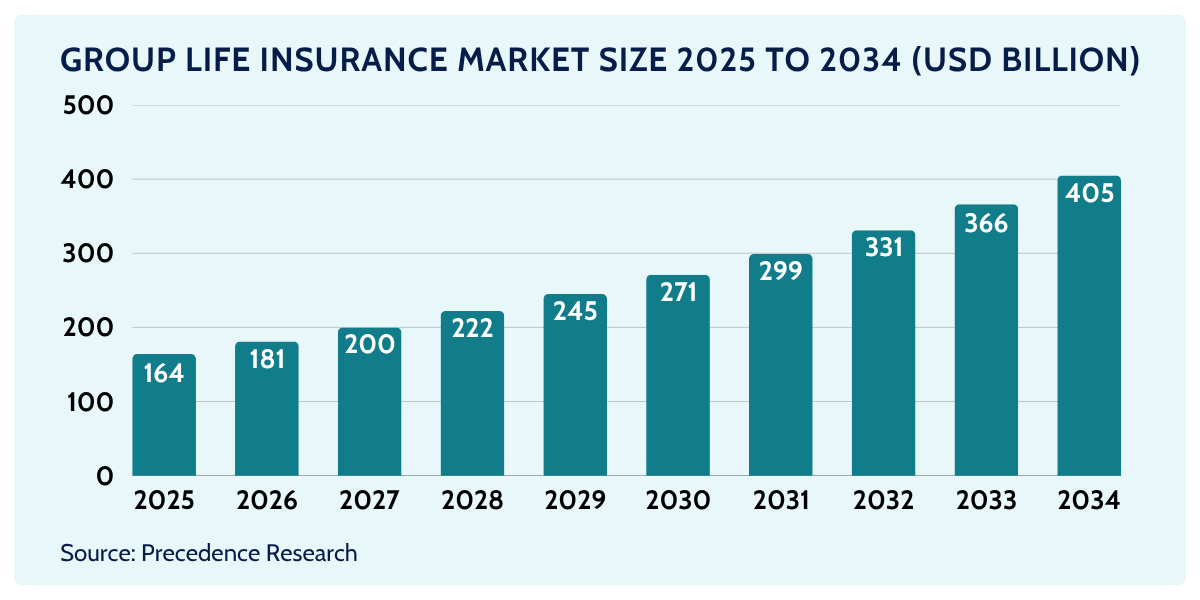
- Group life insurance (global): estimated $148.7B in premiums in 2024, projected to reach ~$405B by 2034 at ~10.5% CAGR (2025–2034). North America holds the largest share today; term life dominates group benefits due to affordability. (Group Life Insurance Market | Precedence Research)
- Individual life: the workhorse of the sector—covering protection (term) and permanent policies with savings elements (whole life, UL/IUL, VUL). The product mix above shows how individual sales skew across guarantees vs. market-linked designs in a higher-rate world.
How Many People Have Life Insurance Coverage?
Life insurance ownership varies widely by region, but one theme is consistent: many households still lack enough coverage even as intentions to purchase life insurance remain strong.
- United States. About 51%–52% of U.S. adults report having life insurance (individual and/or through work). At the same time, ~102 million adults say they either lack coverage or don’t have enough, and 37% say they plan to buy life insurance in the next 12 months. ( LIMRA ; LIMRA Fact Sheet ).
- European Union (snapshot). In EIOPA’s 2024 Eurobarometer, 22% of EU consumers reported owning “other life insurance” and 18% reported owning an IBIP (investment-based life product). These categories aren’t perfectly comparable to U.S. measures, but they show relatively lower life insurance ownership in much of Europe. ( EIOPA ).
- United Kingdom. The FCA Financial Lives 2024 survey found 28% of UK adults held a life insurance policy. ( FCA ).
The Protection Gap (How Far Coverage Falls Short)
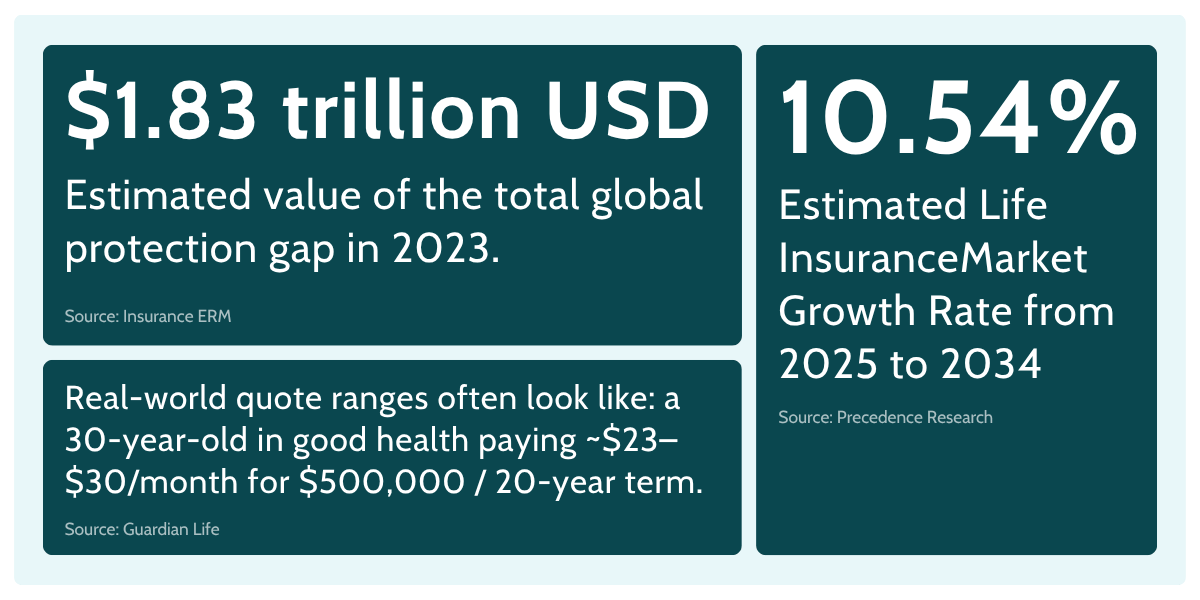
Measured globally, the mortality protection gap remains wide: Swiss Re estimates it at about $414 billion in premium-equivalent terms in 2023—essentially the extra annual premiums households would need to close shortfalls in death-benefit protection (Swiss Re sigma Resilience Index 2024).
Looking across all major perils (mortality, health, natural catastrophes, crop), the total global protection gap reached a record ~$1.83 trillion in 2023, underscoring the scale of underinsurance worldwide (InsuranceERM)
In the U.S., this shortfall shows up in consumer intent: 42% of adults—about 102 million people—say they need life insurance or more of it, and over a third plan to buy life insurance in the next year, signaling both unmet need and purchase intent (LIMRA news release)
(Read also: Embedded Insurance Statistics and Market Dynamics (2026))
Life Insurance Statistics by Age
Younger generations tend to start with term coverage (often tied to mortgages and kids), while older cohorts are more likely to hold permanent life insurance policies.
The life insurance industry watches this age gradient closely because it shapes product design, advice, and the moment when consumers finally move from intent to purchased insurance.
U.S. Life Insurance Ownership by Generation (2025)
- Gen Z Adults 36%,
- Millennials 50%,
- Gen X 55%,
- Baby Boomers 57%
Other Age Related Insurance Statistics
- Cost misconceptions slow action: 72% of U.S. adults overestimate the price of a basic term policy, and over half say their estimate is a “guess,” which delays decisions to purchase life insurance and contributes to under-ownership among younger adults (LIMRA Insurance Barometer 2024)
- Overall ownership vs. need (U.S., 2024): About half of adults say they own life insurance; yet 42% (≈102 million adults) say they need coverage or more of it, and 37% intend to buy within 12 months — a large pool that has not yet purchased insurance (LIMRA)
- United Kingdom snapshot (2024): 28% of UK adults held a life insurance policy, with higher incidence among mid-life households juggling mortgages and dependents (FCA)
Life Expectancy in the U.S. and Europe
Life expectancy steers pricing, underwriting, and guarantees across the life insurance industry. The post-pandemic rebound in longevity is gradually reshaping assumptions behind both protection and savings-type life insurance products.
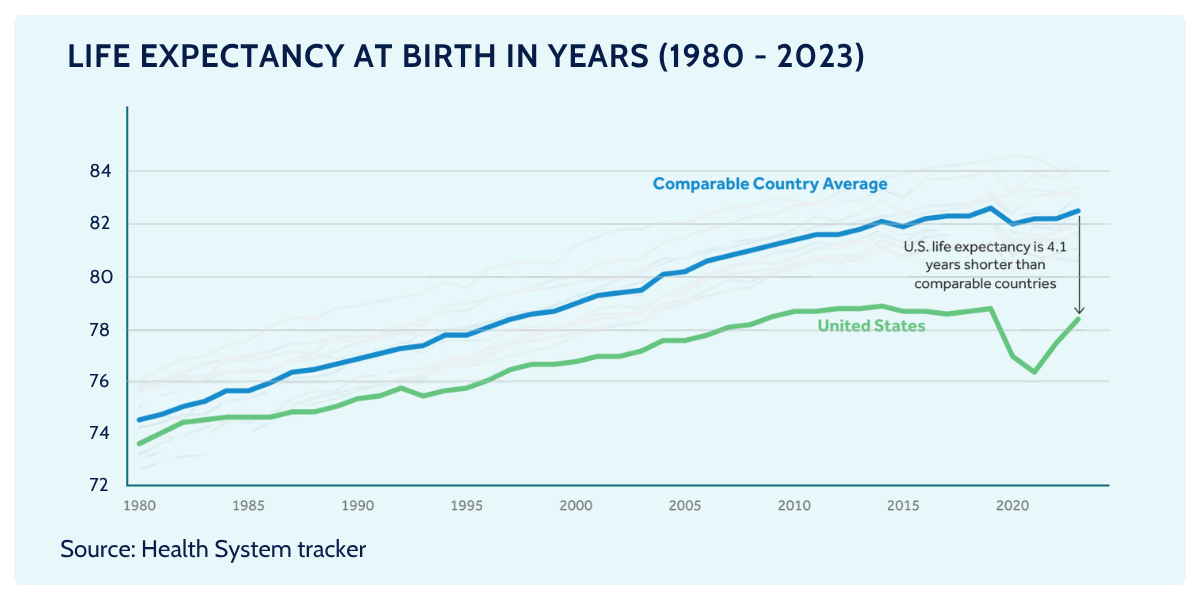
- United States (2023): Life expectancy rose to 78.4 years, up 0.9 years from 2022, as mortality pressures eased (CDC)
- European Union (preliminary 2024): Life expectancy is estimated at 81.7 years, +0.3 vs. 2023 — remaining several years above the U.S. (Eurostat)
- United Kingdom (period measure 2021–2023): Life expectancy at birth was 78.8 for males and 82.8 for females; at age 65, cohort projections indicate ~19.8 more years for men and ~22.5 for women (ONS national life tables)
- EU context (2023): OECD/EC reports EU life expectancy averaged ~81.5 years, having regained pre-pandemic ground, though with sizable country gaps (OECD/EC)
Term and Whole Life Insurance Compared
In today’s life insurance market, consumers are choosing among a spectrum of life insurance policies that trade off cost, guarantees, flexibility, and investment risk. In the U.S. individual life insurance market, 2024 sales show that guarantees still matter while flexible, market-linked designs are gaining share: whole life accounted for 36% of new premium, term life for 19%, fixed universal life for 7%, indexed universal life for 24%, and variable universal life for 14% (LIMRA year-end 2024 sales summary (LIMRA)
Term life is the purest form of life insurance coverage: a straightforward death benefit for a set period, typically 10–30 years. You’re paying for protection, not savings.
That’s why term is the go-to for income replacement, mortgages, and raising kids—it maximizes coverage per dollar and keeps decisions simple. Many contracts include a conversion option, so if life gets more complex you can exchange into a permanent policy without new medical evidence. For a lot of households, term is the on-ramp to lifelong planning.
Whole life is the opposite end of the spectrum: permanent coverage, level premiums, and guaranteed cash value growth set by the insurer (with potential dividends in participating contracts).
Think of it as a disciplined, long-horizon chassis—used for legacy goals, business planning, or simply avoiding the risk of going uninsured later in life. You’re buying contractual certainty, and you pay for it. In return, you get guarantees that don’t depend on markets and a policy designed to be held for life.
Between those poles sits the universal life family, which lets you dial the balance between guarantees and growth.
A traditional (fixed-rate) UL credits interest at insurer-declared rates and gives you levers to adjust premiums and the death benefit within limits. Indexed universal life links credits to an index (like the S&P 500) with caps and floors—appealing if you want some upside participation without full market risk. Variable universal life goes all-in on investment choice: cash values are invested in separate accounts tied to markets, with higher growth potential and higher volatility. The common thread is flexibility—but also more moving parts. These designs reward engaged policyholders who value control over funding patterns and accumulation, and they require careful monitoring.
So which fits? If you need the most coverage today, term usually wins on price and clarity.
If your priority is lifetime guarantees and a built-in savings element, whole life is built for staying power. If you want adjustable funding and targeted growth, the UL family offers knobs to turn—fixed UL for stability, indexed universal life for market-linked credits with floors, variable universal life for full market exposure.
[Read also: 2026 Cyber Insurance Statistics and Trends]
Average Life Insurance Costs
Two realities dominate the life insurance market today: (1) term coverage is still extremely affordable for healthy buyers, and (2) permanent coverage (whole life and the UL family) costs much more because it’s built for lifetime protection and cash value. Rates below are typical illustrations—not quotes—and they vary by age, health, smoker status, term length, coverage amount, and underwriting class.
- A widely cited benchmark is a 40-year-old, healthy nonsmoker buying a 20-year, $500,000 term life policy. The average cost is about $26 per month. (NerdWallet)
- Real-world quote ranges often look like: a 30-year-old in good health paying ~$23–$30/month for $500,000 / 20-year term, depending on sex and underwriting class. (Guardian Life)
- As terms get longer, premiums rise. For a healthy 40-year-old, average annual rates for a $500,000 term policy are $203 (10-year), $331 (20-year), and $579 (30-year)—the extra years simply add more risk for the insurer. (NerdWallet)
- Smoking is the biggest price shock. A 40-year-old male nonsmoker pays about $331/year for that 20-year, $500,000 term policy; a smoker pays roughly $1,489/year—over 4× more. (NerdWallet)
- Average monthly cost data published by large UK providers/brokers suggest a typical term life insurance policy runs ~£28–£33 per month, depending on mix of ages, terms, and smoker status in the sample. Legal & General reports £27.95 (2024 data), while Reassured’s analysis across 121,561 policies shows £32.64 (2024). (Legal & General)
[Read also: Pet Insurance Statistics, Facts and Trends (2026)]
Life Insurance Trends
The mood in life insurance moving into 2026 is steady.
Here are some key trands that will shape the next few quarters of the life insurance market.
Product mix: guarantees + upside.
With yields back to normal-ish, buyers still want the cost-efficiency of term and the certainty of whole life—but they’re increasingly open to policies that credit interest more dynamically. That’s why indexed universal life (upside with floors) and accumulation-focused designs keep gaining attention, while annuity-linked retirement solutions remain a growth engine for life insurers.
Distribution: embedded and bancassurance everywhere.
Life won’t be sold only in a branch or an agent’s office. Banks, fintech apps, and employer ecosystems are weaving simple, event-triggered protection into day-to-day financial journeys—think mortgage flows, payroll apps, or savings goals. Several strategists now see embedded insurance taking a material share of product distribution by the late 2020s, propelled by open finance data and real-time eligibility checks.
Gen-AI moves from pilots to productivity.
The signal in 2026 is less “shiny demo,” more “measurable lift.” Carriers report gen-AI helping draft clear customer communications, summarize medical files, and guide frontline staff—often with quality wins that beat human-only baselines. Over the next 12–24 months, expect targeted scale-ups in new-business intake, service, and compliance documentation, with governance and model-risk controls maturing in parallel.
Regulation and capital: “funded re” in the spotlight.
Supervisors on both sides of the Atlantic are probing funded (asset-intensive) reinsurance used in bulk annuity and life blocks, tightening stress tests and asset-adequacy rules.
(Read also: AI in Insurance Industry: Statistics, Trends, Adoption, and Investments (2026))
Closing Thoughts
Term remains the most efficient way to secure meaningful protection now, while permanent options and the UL family add lifetime guarantees and flexibility as needs grow.
With ownership still uneven and protection gaps persistent, the industry’s job is to keep products simple, accessible, and fairly priced.
For households, the smartest move is to match policy design to real goals, revisit coverage as life changes, and act—because the cost of waiting is almost always higher.
&p[summary]=Executive briefing on the 2026 life insurance market - ownership, costs, protection gap, and trends you need to know.)